The spring market showed more life than January, but the numbers still point to a tightening market, not a full recovery. Demand improved. Supply stayed heavy. Pricing power remained fragile.


The March 2026 TRREB data points to a market that is clearly healthier than the weak January start, but still not strong enough to give sellers broad pricing leverage. Sales improved materially through the quarter, months of inventory moved lower, and the market felt less frozen. But active inventory stayed elevated and benchmark pricing remained negative year over year.
That combination matters because it separates activity from pricing power. More homes traded. That does not mean sellers regained control.
Section 1
What changed from January to March
January opened weak. February improved. March improved again on volume, but not enough to erase the inventory overhang. The quarter tells a simple story: buyers re-engaged faster than prices recovered.

Section 2
The market economics, in plain English

Demand improved
Sales rose from 3,082 in January to 5,039 in March. That is a 63.5% gain across the quarter. It tells us buyers were coming back into the market after a very soft start to the year.
Supply also stayed heavy
Active listings rose from 17,975 to 21,596 over the same period, an increase of about 20.1%. So while more homes sold, buyers still had a lot of choice. That kept negotiation leverage from swinging fully back to sellers.
Absorption improved, but not enough to create broad seller power
SNLR improved from 28.6% in January to 36.1% in February, then eased to 34.9% in March as seasonal listing flow came back. MOI improved from 5.8 to 4.3, which is constructive. But 4.3 months is still not scarce inventory.
Section 3
Why prices are still lagging
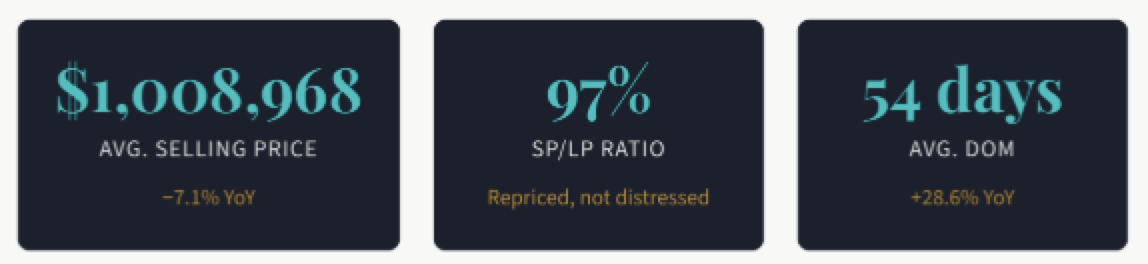
The average selling price rose from $973,289 in January to $1,017,796 in March, but that quarter-to-quarter improvement does not mean the market healed. On a year-over-year basis, average price stayed negative throughout the quarter: down 6.5% in January, 7.1% in February, and 6.7% in March. The MLS HPI Composite benchmark also stayed negative, moving from -8.0% to -7.4%.
That is the clearest numerical proof that pricing remained under pressure. The market was stabilizing, not surging.

Section 4
The Bank of Canada backdrop
The Bank of Canada held the policy rate at 2.25% on January 28 and again on March 18, 2026. That means the spring pickup in housing activity was not driven by fresh rate relief during the quarter. The market improved under a stable, not newly stimulative, rate environment.
That distinction matters. The quarter did not improve because policy suddenly turned loose. It improved because buyers gradually adjusted to the prevailing rate environment, lower prices than a year ago, and a market that was no longer deteriorating as quickly as before.

In other words, the March market was adjustment-driven rather than stimulus-driven. That helps explain why activity improved while pricing remained fragile.
Section 5
Strategic implications
For sellers
This is a market that still punishes weak launch strategy. Sellers who overprice, underprepare, or misread early demand signals remain vulnerable because buyers still have alternatives. Precision matters: pricing, presentation, positioning, and speed of adjustment are doing more of the work than broad market momentum.
For buyers
Buyers still have negotiating room, but not as much as they had in January. Better listings are more likely to get serious engagement, while exposed listings still create opportunity. This is a market that rewards discrimination, not blanket low-balling.
For market interpretation
The cleanest framing is this: the GTA market is tightening, but it is not healed. It is healthier than the weak January opening suggested, yet still too inventory-heavy to call it a true seller market.
Bottom line
This is not 2021. It is not frozen either. It is a disciplined, selective market where strategy still matters more than optimism.
Suggested website CTA: Need help reading what the March market actually means for your property, timing, or buying strategy? Book a private consultation.
Sources: TRREB Market Watch reports for January, February, and March 2026; Bank of Canada rate announcements on January 28 and March 18, 2026.
Prepared for: Olivia Williams Realty · @oliviawilliamsrealty